
The Quest for Exoplanets
Humans have long sought planets beyond our solar system, driven by profound questions about planetary formation, the prevalence of Earth-like worlds, and the tantalising possibility of extraterrestrial life. The pursuit of answers to these questions has seen significant strides with the discoveries of hundreds of exoplanets through missions like Kepler and TESS. While the search for signs of life continues, astronomers have gleaned valuable insights, revealing a diverse array of exoplanets in terms of size, temperature, and composition. The confirmation of more exoplanets promises to improve our understanding of planetary demographics.
The TESS-Atlas and Its Scientific Impact
Surveys of data from TESS have unveiled over six thousand exoplanet candidates. However, distinguishing genuine candidates from systematic effects and astrophysical sources requires rigorous validation. The TESS-Atlas aims to play a crucial role in this process, offering a comprehensive posterior catalog for all TESS candidates. The TESS-Atlas website not only documents detailed analyses for each candidate but also serves as a valuable resource for initiating new studies.
Moreover, the TESS-Atlas provides an API, facilitating easy access to results, useful for modeling ensemble population parameters for all exoplanet candidates. Drawing parallels with the Kepler posterior catalog (Rowe et al., 2014), the TESS-Atlas proves invaluable for the exoplanet community. Additionally, the software underpinning the TESS-Atlas catalog has broader applications and has found utility in the gravitational wave community, as evidenced by its use in the NRSurCat-1 catalog (https://nrsur-catalog.github.io/NRSurCat-1, https://arxiv.org/abs/2309.14473).
The TESS-Atlas can not only advance our understanding of exoplanets but also contribute to the broader scientific community through the adaptable software infrastructure it offers.
Achievements of the ADACS project
The ADACS development team played a crucial role in addressing key challenges faced by the TESS-Atlas project. Initially, as the number of exoplanet candidates approached 5,000, the existing catalog web-builder proved non-scalable and began encountering failures. Manual re-running of the TESS-Atlas pipeline, triggered by new candidates published by NASA’s TESS data analysis team, added further complexity.
The ADACS development project effectively tackled these pain points by offering solutions that addressed scalability issues and provided valuable guidance on refactoring and modularizing the code. The transition from a monolith to a microservice architecture significantly facilitated automation and testing processes. Collaborating with the ADACS team, we systematically refactored the codebase, identifying and resolving bottlenecks in the web-building process responsible for scalability challenges.
The ADACS team successfully developed a solution that rectified the web-building bottleneck and resulted in a remarkable improvement in website construction time, reducing it by a factor of 4. The memory usage was also optimised from over 80GB to approximately 20GB.
The ADACS team introduced a custom Job Controller to enhance automation and orchestrate various microservices within the TESS-Atlas pipeline. This tool facilitated communication between the TESS-Atlas Nectar server, the NASA database via Github actions (for weekly checks on new exoplanet candidates), and OzStar (for launching analyses on new candidates). Upon completion of the analyses, the ‘Job Controller seamlessly relayed the analysed results back to compile the website on the Nectar server.
Fixing TESS-Atlas’ bottlenecks and the development of a ‘Job Monitor’ would have been a significantly more time-consuming task without the invaluable assistance and expertise provided by the ADACS team.
IMAGES
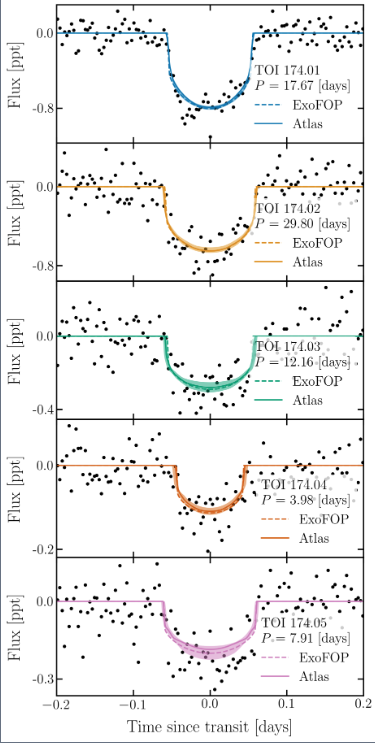
Fig 1: TESS-Atlas results for the TESS-Object of Interest 174 (TOI-174). Each panel displays the folded lightcurve data for one of the five exoplanet candidates’ in the star system discovered with the transit method. The dashed curve shows the prior estimates for the transit, while the shaded region displays the TESS-Atlas 90% credible interval for the transit. For more information on the transit method or this work, please refer to the TESS-Atlas website.
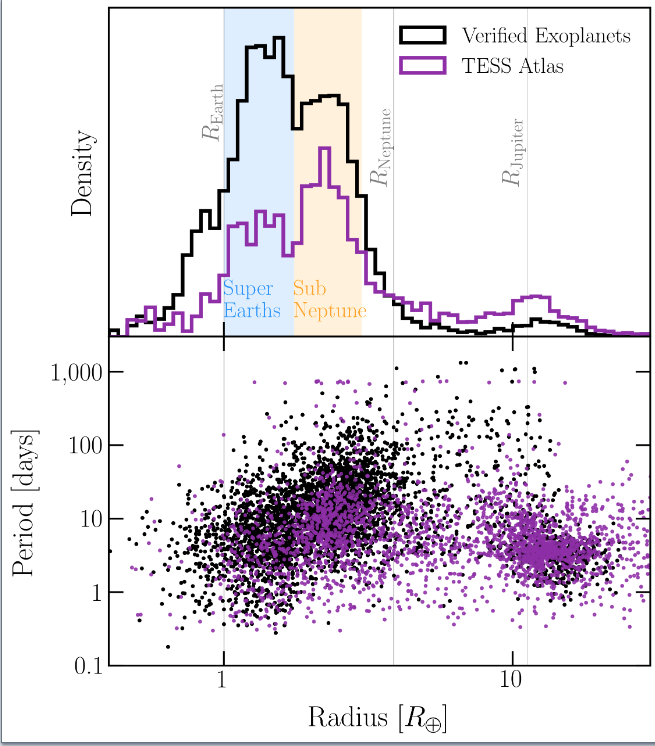
Fig 2: Bottom panel: Period versus radius plots for the median values of the TESS-Atlas exoplanet parameter estimates in purple, while the best-fit values of the confirmed exoplanets in the NASA ExoFOP database are in black. Top panel: The densioty plot for the radii estimates from the TESS-Atlas (purple) and the NASA .For more information on the transit method or this work, please refer to the TESS-Atlas website.